
Mentamorph
Summary
Project Manager
UX/ UI Designer
Date
Role
June-July 2023
My team and I created a teacher portal for an educational finance game for highschool students
A Glance at the Final Product.
The breakdown
MentaMorph, a financial application, has been ingeniously designed with an immersive gaming structure that seamlessly integrates various elements of financial decision-making and simulations. In order to adapt MentaMorph for educational environments, a dedicated platform was imperative, one that would empower educators to introduce the game, engage with students, and provide interactive feedback. My task involved assembling a team of individuals and crafting an intuitive and versatile teacher dashboard.
Participating in this dynamic sprint with MentaMorph provided me with valuable experience in design thinking and interdepartmental communication. I'm enthusiastic about witnessing our product revolutionize the approach to teaching students about finance, preparing future generations for success!
Design responsibilities: wire-framing, usability testing, hi-fi prototyping, logo redesign
Research responsibilities: user outreach, structured interviews, affinity mapping
Step zero
Before jumping into this project, my team and I were quick to identify a number of notable discrepancies. First and foremost, we noted a range of design inconsistencies within MentaMorph, particularly in terms of its color scheme and typography. Moreover, during the project's initial stages, I conducted an analysis of the user sample provided by our client for interviews, recognizing the potential for bias. To ensure the collection of the most accurate and unbiased data, we decided to recruit interviewees ourselves. Faced with these additional responsibilities and the constraint of limited time, we were well aware that our success hinged on our ability to maximize productivity. Thus, we adopted a strategy of dividing and conquering, effectively tackling the day's scheduled tasks with a clear focus on efficient execution.
Understanding our competitors
Competitive/comparative analysis

After speaking with our client and stakeholders to gain a clear understanding of the scope and expectations of our project, it was time to dive straight into looking at what other teacher platforms were offering through a competitive/comparative analysis. We then analyzed platforms Kahoot, Nearpod, and Duolingo and gathered key insights to help us get started in the right direction.
Talking with teachers
User Interviews
After our analysis, the research team interviewed 5 teachers all teaching at k-12 schools via zoom. We had the objectives of evaluating the methodologies educators use to track progress within the classroom, record participation methods educators use to engage with their students, and assess how educators onboard their students for online programs.
Affinity Mapping
Based on the insights and data that we received from our user interviews, our group affinity mapped their behaviors and pain points. Some of the commonalities found were; needing a way to keep students engaged, an easy way to give students feedback, finding the program onboarding process difficult and time consuming, etc. With these pain points and behaviors we were then able to craft our Persona.

“Onboarding is a nightmare. It takes a long time teaching students how to use the program.”
“I find it hard to keep students engaged asynchronously.”
“I lack inspiration to create simulation based learning experiences.”
Crafting a persona

Meet Anne, a 34-year-old high school teacher, residing in Los Angeles, California who finds herself lacking inspiration to incorporate simulation based learning into her classroom. Pulling directly from quotes from our user interviews we identified trends in particular frustrations, needs, and behaviors expressed from teachers like Anne.With a firm understanding of our users' behaviors and motivations, we can now create meaningful and personalized experiences that resonate with our audience.
P r o b l e m S t a t e m e n t“Users need a streamlined and intuitive teacher dashboard for a financial literacy app to efficiently track student progress and provide feedback. This will enable them to effectively assist students in their money management learning journey.”
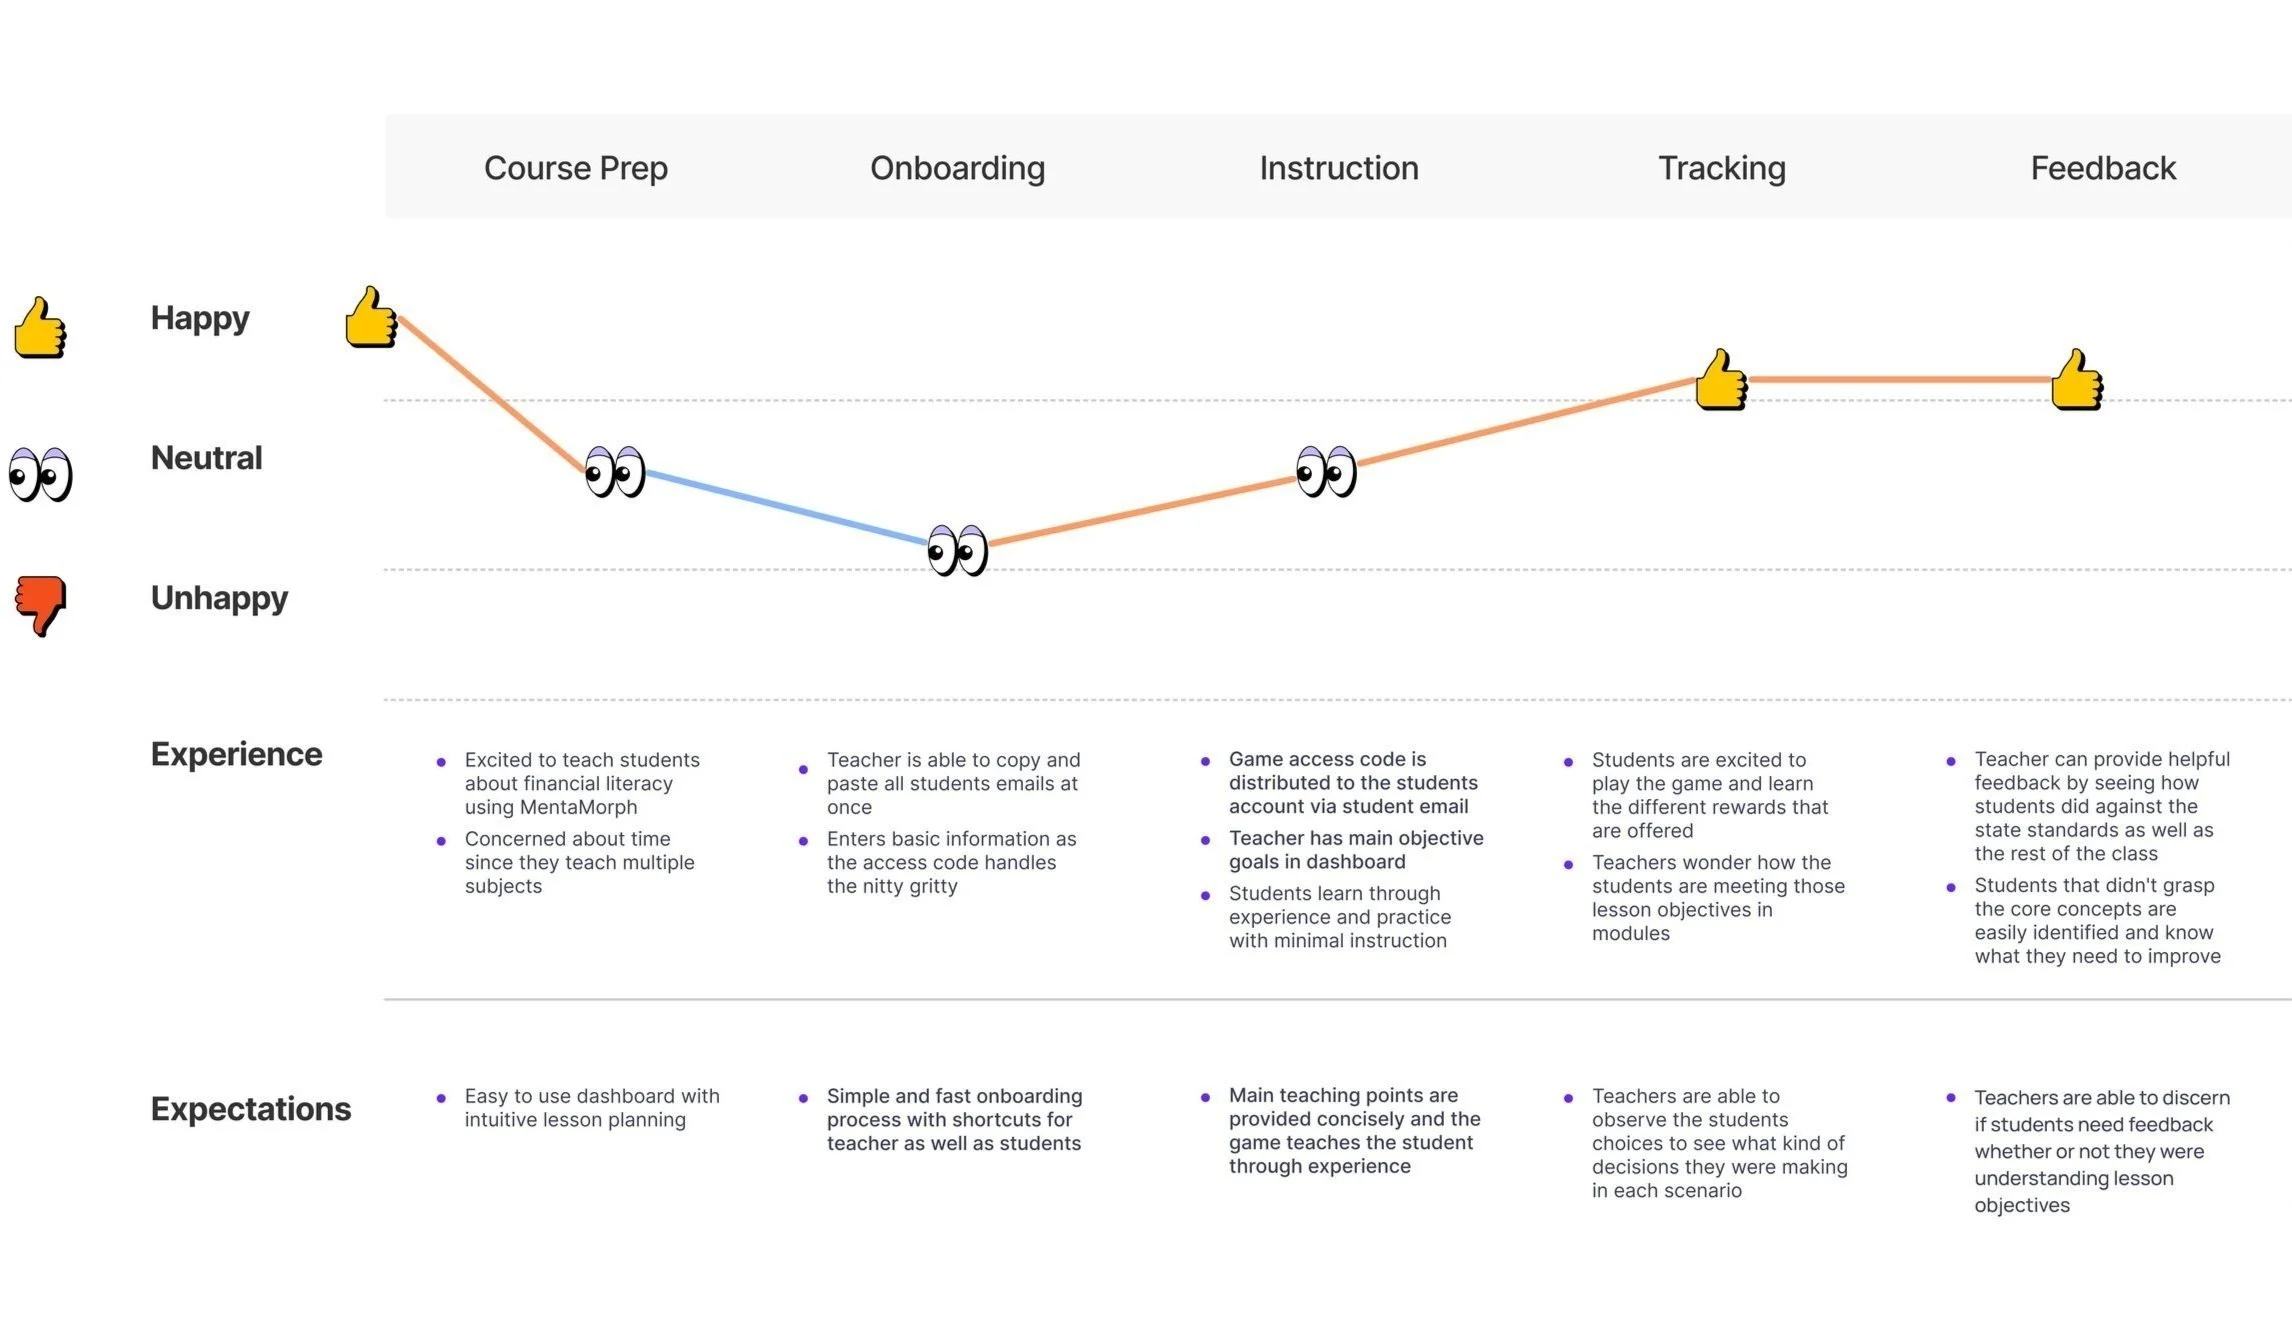
Mapping our users journey
From the perspective of Anne, we mapped out her journey while using MentaMorph to teach financial literacy along with the accompanying teacher dashboard. When it comes to instruction, The game itself is the most valuable learning tool as students will grow each time they replay it, Anne will be able to easily facilitate and expedite their learning by having the main objectives stated clearly on the dashboard. Additionally, Anne will have the main objectives as well as a list of how many students are not meeting these objectives and potentially not grasping the core concepts that go with them, helping her easily track student progress. Being able to easily see which students are falling behind will make it easy for teachers to provide timely and effective feedback to the students that need it the most ensuring that they don't fall behind in the modules ending this stress free journey
STarting the design process
Design principles
Through our user interviews and affinity mapping, we were able to identify pain points that teachers usually have w/ dashboards. We then used these findings to create three design principles that informed our design/ideation process going forward.
Streamlined Onboarding Process
Intuitive dashboard elements
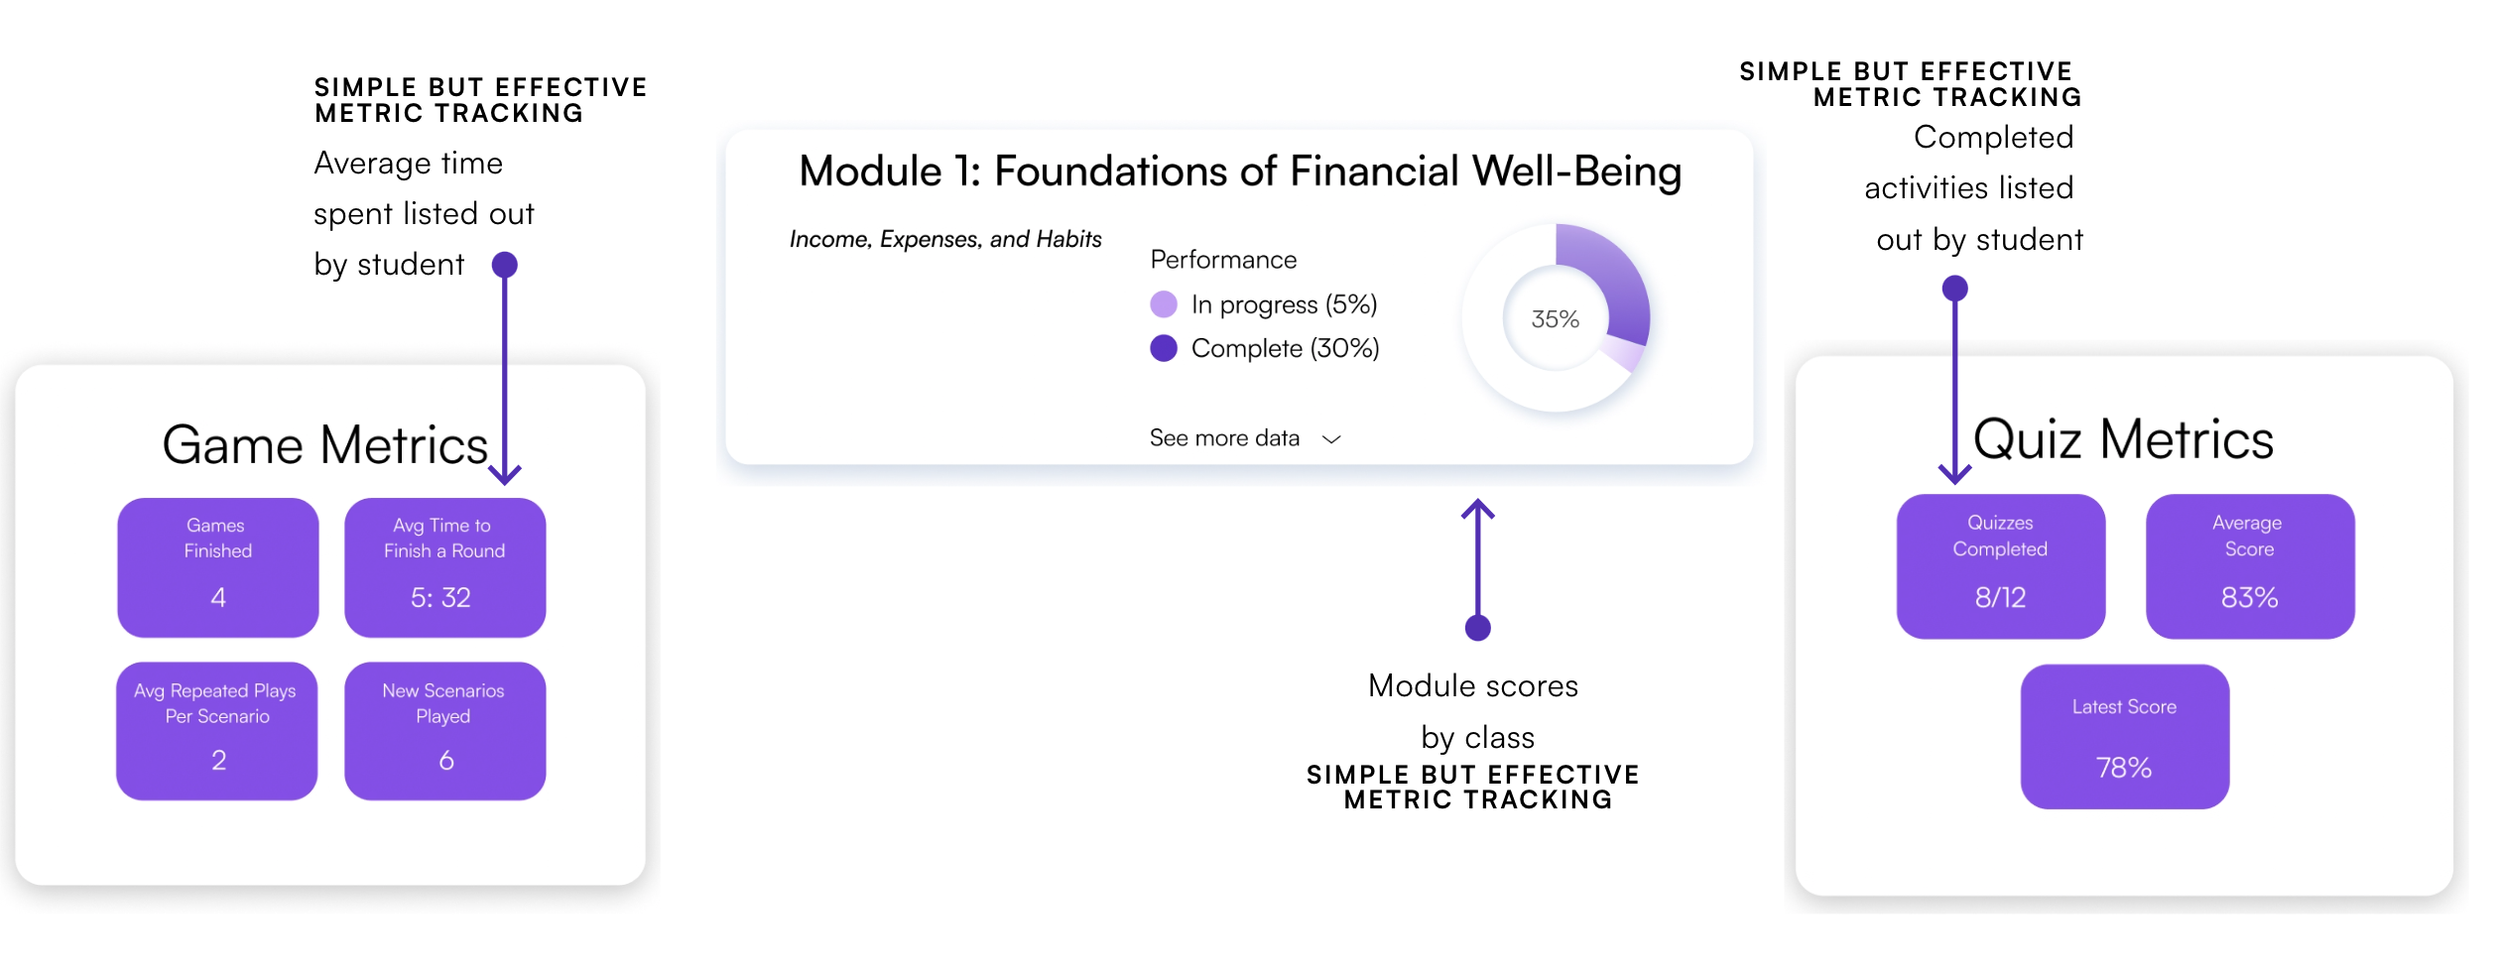
SImple yet effective Metric tracking
Some sketches

Usability Testing Lo-Fi Frames
After completing our wireframes, my group members conducted 4 moderated usability tests with teachers from K-12 schools. In testing, we wanted to ensure that our information hierarchy was user friendly and intuitive, that users were able to access relevant information on the dashboard, that they were able to easily track student progress provide them with feedback, AND identify any pain points users may have when navigating the dashboard

Task 01
(Streamlined Onboarding process)Create an account and register your students emails into the game in order fot them to have their information on the dashboard


Task 02
(Intuitive dashboard elements & simple yet effective metric tracking)You want to know if students were collecting their emergency expenses for Module 1 in the game. Find which Students failed to pay their essential expense or emergency expense.

Task 01
Streamlined Onboarding Process
> 3/4 users had less than 3 misclicks
> 4/4 users spent about 2 minutes
> Ease of use 5/5
Task 03
(Intuitive dashboard elements & simple yet effective metric tracking)Imaging that you have completed some of the module with your students, you want to check your student Sarah B’s metrics. Locate her Quiz completion rate.

LOFI Usability test findings
Takeaways
We found 4 key takeaways from our first round of usability testing.
More control from dashboard homepage. Users wanted more access to other sections which was remedied by further building out the prototype
Difficulty navigating to modules. This too was addressed when completing the prototype, as it gave users access to modules from main homepage section.
“Okay” button in onboarding flow was confusing. An “okay” button on the confirmation page was unnecessary so it was removed.
More descriptions or subheadings in modules necessary. users had trouble understanding what certain statistics measured so we added descriptive titles to make it clear what they were looking at
Task 03
(Intuitive dashboard elements & simple yet effective metric tracking)
>2/4 users had more than 3 misclicks
>3/4 users spent about 1.5 minutes
>Ease of use 4/5
Task 02
(Intuitive dashboard elements & simple yet effective metric tracking)
> 4/4 users had on average 1 misclick
> 4/4 users spent about 1 minute
> Ease of use 4/5
The hifi PROTOTYPE
Classroom management
We understand that time is precious for teachers which is why we prioritized a hassle free and smooth onboarding process. Clear instructions and intuitive prompts will lead you effortlessly through the initial setup.

Data is crucial.. so we emphasized Student Progress Tracking.
Data is vital to understanding student performance and tailoring instruction which is why we focused on providing valuable metrics for tracking student progress. Teachers can access real-time data on each student’s engagement and performance metrics.
These reports can be used to assess the effectiveness of teaching strategies, identify areas that require reteaching, and inform future lesson planning.

Intuitive layout and quick access allows teachers to provide seamless feedback.
The detailed performance analytics feature provides comprehensive insights into student performance.
This enables teachers to make data-driven instructional decisions as well as empowers them by allowing to understand individual and class-wide progress in-depth. Visual representations of student performance facilitate easy comparison and help teachers identify patterns or areas that require additional focus quickly and easily.

By adhering to these design principles in our design process of MentaMorph's teacher dashboard we were able to deliver an optimal user experience.
We streamlined the onboarding process, offered intuitive dashboard elements, and provided simple but effective metric tracking. As a result, teachers can efficiently manage their classrooms, monitor student progress, and make informed instructional decisions with confidence and ease.
We also know that a well-organized dashboard is key to an enjoyable user experience. Which is why our new teacher dashboard boasts an intuitive layout with important features like the inbox being strategically placed for quick access so teachers can provide students feedback quickly and seamlessly.

Teachers can also generate class-level reports that aggregate data and provide an overview of overall class performance.
HIFI Usability test findings
round 2 Testing Results
Once again, we conducted moderated tests and this time with 3 users. Like before, users were overall able to complete tasks with ease.
Task1
3/3 users had direct success
The average time was 1 minute 9 seconds
(Streamlined Onboarding process)(Intuitive dashboard elements & simple yet effective metric tracking)Task 2
2/3 users had direct success with an average of 12 seconds
1/3 users had indirect success with an average of 1 minute
However, we still received valuable feedback on how to improve our design and create a smoother process for Anne. We asked users to give ratings from 1-10 on ease of use and confidence using the product without assistance. With high ratings of 9.5 for ease of use and 9 for confidence using product without assistance, my team and I were able to take a sigh of relief and give one another virtual high-fives.
Task 3
(Intuitive dashboard elements & simple yet effective metric tracking)2/3 users had direct success with an average time of 25 seconds
1/3 users had indirect success with 1 minute and 28 seconds
Ease of use
9.5 / 10
confidence using product without assistance:
9.5 / 10
Next steps
Going forward, I would include creating a student dashboard that works smoothly with the pre-existing teacher dashboard. It would also include a mobile version of the dashboard being developed in order to give teachers more access. Additionally, I would like to add more customization options and reward systems within that platform to increase engagement. Lastly, either an optional tutorial or more descriptive help for more complex features of the dashboard would be integrated to aid teachers in becoming more comfortable with the use of those features.